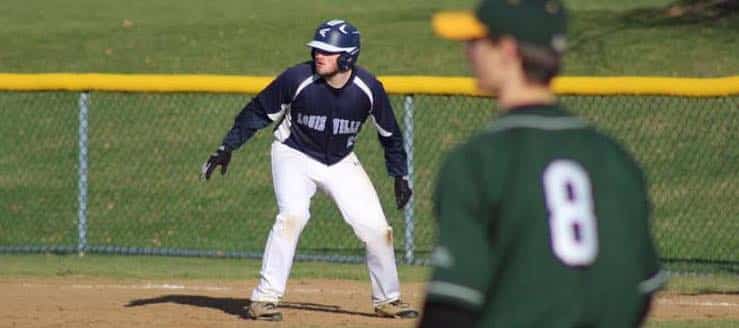
2017 Louisville Leopards Freshman Baseball Season
Home » Baseball » Freshman » History » 2017
Louisville Leopards 2017 Freshman Baseball Batting Statistics
Standard
| |
Jackson Kandle |
1 |
3 |
3 |
2 |
2 |
0 |
0 |
0 |
2 |
0 |
0 |
0 |
0 |
0 |
0 |
1 |
.667 |
.667 |
.667 |
1.333 |
| |
Jonah Harsh |
23 |
82 |
68 |
34 |
24 |
6 |
4 |
0 |
22 |
25 |
1 |
0 |
0 |
0 |
12 |
5 |
.500 |
.573 |
.706 |
1.279 |
| |
Drew Layton |
19 |
49 |
42 |
16 |
16 |
0 |
0 |
0 |
14 |
4 |
1 |
1 |
0 |
0 |
6 |
5 |
.381 |
.469 |
.381 |
.850 |
| |
Turnner Giles |
19 |
50 |
44 |
16 |
14 |
2 |
0 |
0 |
7 |
10 |
1 |
3 |
1 |
0 |
4 |
9 |
.364 |
.420 |
.409 |
.829 |
| |
Carter Rode |
20 |
76 |
60 |
20 |
9 |
9 |
2 |
0 |
17 |
23 |
4 |
2 |
2 |
0 |
12 |
21 |
.333 |
.474 |
.550 |
1.024 |
| |
Grayson Beamer |
23 |
84 |
66 |
21 |
18 |
2 |
1 |
0 |
13 |
22 |
5 |
3 |
3 |
0 |
13 |
11 |
.318 |
.464 |
.379 |
.843 |
| |
Nathan Halasinski |
15 |
24 |
20 |
6 |
6 |
0 |
0 |
0 |
3 |
2 |
0 |
2 |
0 |
0 |
4 |
7 |
.300 |
.417 |
.300 |
.717 |
| |
Jake Bevere |
20 |
60 |
44 |
12 |
12 |
0 |
0 |
0 |
8 |
12 |
1 |
5 |
1 |
0 |
15 |
7 |
.273 |
.467 |
.273 |
.739 |
| |
Austin Pugh |
20 |
76 |
70 |
19 |
18 |
1 |
0 |
0 |
12 |
18 |
0 |
3 |
3 |
0 |
5 |
12 |
.271 |
.316 |
.286 |
.602 |
| |
Hunter Selander |
21 |
66 |
58 |
15 |
14 |
0 |
1 |
0 |
8 |
15 |
6 |
6 |
2 |
0 |
2 |
17 |
.259 |
.348 |
.293 |
.642 |
| |
Christan Marcelli |
11 |
12 |
9 |
2 |
2 |
0 |
0 |
0 |
2 |
2 |
2 |
0 |
0 |
0 |
1 |
4 |
.222 |
.417 |
.222 |
.639 |
| |
Andrew Figler |
23 |
80 |
69 |
14 |
13 |
1 |
0 |
0 |
8 |
15 |
3 |
3 |
2 |
0 |
8 |
21 |
.203 |
.313 |
.217 |
.530 |
| |
Kyle Kerchner |
16 |
28 |
26 |
5 |
5 |
0 |
0 |
0 |
2 |
4 |
2 |
0 |
0 |
0 |
0 |
14 |
.192 |
.250 |
.192 |
.442 |
| |
Logan Vanicek |
16 |
51 |
40 |
7 |
6 |
1 |
0 |
0 |
6 |
11 |
0 |
3 |
3 |
0 |
9 |
8 |
.175 |
.320 |
.200 |
.520 |
| |
Justin Blyer |
2 |
8 |
7 |
1 |
1 |
0 |
0 |
0 |
2 |
1 |
0 |
1 |
0 |
0 |
1 |
1 |
.143 |
.250 |
.143 |
.393 |
| |
Josh Nolte |
2 |
7 |
1 |
0 |
0 |
0 |
0 |
0 |
0 |
2 |
0 |
0 |
0 |
0 |
6 |
1 |
.000 |
.857 |
.000 |
.857 |
| 23 |
756 |
627 |
190 |
160 |
22 |
8 |
0 |
126 |
166 |
26 |
32 |
17 |
0 |
98 |
144 |
.303 |
.416 |
.364 |
.780 |
Patience, Speed, & Power
| |
Jonah Harsh |
23 |
82 |
68 |
6.833 |
2.400 |
.926 |
12 |
1 |
.923 |
0 |
0 |
0 |
10 |
48 |
.000 |
.500 |
.706 |
| |
Jackson Kandle |
1 |
3 |
3 |
.000 |
.000 |
.667 |
0 |
0 |
.000 |
0 |
0 |
0 |
0 |
2 |
.000 |
.667 |
.667 |
| |
Carter Rode |
20 |
76 |
60 |
6.333 |
.571 |
.650 |
21 |
2 |
.913 |
0 |
0 |
0 |
11 |
33 |
.000 |
.385 |
.550 |
| |
Turnner Giles |
19 |
50 |
44 |
12.500 |
.444 |
.795 |
8 |
2 |
.800 |
0 |
0 |
0 |
2 |
18 |
.000 |
.333 |
.409 |
| |
Drew Layton |
19 |
49 |
42 |
8.167 |
1.200 |
.881 |
3 |
0 |
1.000 |
0 |
3 |
0 |
0 |
16 |
.000 |
.435 |
.381 |
| |
Grayson Beamer |
23 |
84 |
66 |
6.462 |
1.182 |
.833 |
23 |
1 |
.958 |
0 |
1 |
0 |
3 |
25 |
.000 |
.290 |
.379 |
| |
Nathan Halasinski |
15 |
24 |
20 |
6.000 |
.571 |
.650 |
0 |
0 |
.000 |
0 |
0 |
0 |
0 |
6 |
.000 |
.429 |
.300 |
| |
Hunter Selander |
21 |
66 |
58 |
33.000 |
.118 |
.707 |
6 |
0 |
1.000 |
1 |
0 |
0 |
1 |
17 |
.000 |
.200 |
.293 |
| |
Austin Pugh |
20 |
76 |
70 |
15.200 |
.417 |
.829 |
14 |
0 |
1.000 |
1 |
0 |
0 |
1 |
20 |
.000 |
.269 |
.286 |
| |
Jake Bevere |
20 |
60 |
44 |
4.000 |
2.143 |
.841 |
6 |
1 |
.857 |
1 |
1 |
0 |
0 |
12 |
.000 |
.350 |
.273 |
| |
Christan Marcelli |
11 |
12 |
9 |
12.000 |
.250 |
.556 |
0 |
0 |
.000 |
0 |
0 |
0 |
0 |
2 |
.000 |
.333 |
.222 |
| |
Andrew Figler |
23 |
80 |
69 |
10.000 |
.381 |
.696 |
10 |
1 |
.909 |
0 |
1 |
0 |
1 |
15 |
.000 |
.240 |
.217 |
| |
Logan Vanicek |
16 |
51 |
40 |
5.667 |
1.125 |
.800 |
3 |
0 |
1.000 |
1 |
1 |
0 |
1 |
8 |
.000 |
.091 |
.200 |
| |
Kyle Kerchner |
16 |
28 |
26 |
.000 |
.000 |
.462 |
3 |
0 |
1.000 |
0 |
0 |
0 |
0 |
5 |
.000 |
.286 |
.192 |
| |
Justin Blyer |
2 |
8 |
7 |
8.000 |
1.000 |
.857 |
0 |
0 |
.000 |
0 |
0 |
0 |
0 |
1 |
.000 |
.000 |
.143 |
| |
Josh Nolte |
2 |
7 |
1 |
1.167 |
6.000 |
.000 |
1 |
0 |
1.000 |
0 |
0 |
0 |
0 |
0 |
.000 |
.000 |
.000 |
| 23 |
756 |
627 |
7.714 |
.681 |
.770 |
110 |
8 |
.932 |
4 |
7 |
0 |
30 |
228 |
.000 |
.319 |
.364 |
Quality At-Bats & Team Impact
| |
Josh Nolte |
2 |
7 |
1 |
36 |
5.143 |
0 |
.000 |
1 |
.143 |
0 |
0 |
2 |
0 |
0 |
6 |
85.71% |
| |
Jonah Harsh |
23 |
82 |
68 |
301 |
3.671 |
11 |
.134 |
16 |
.195 |
0 |
1 |
31 |
12 |
22 |
49 |
59.76% |
| |
Logan Vanicek |
16 |
51 |
40 |
189 |
3.706 |
6 |
.118 |
11 |
.216 |
1 |
1 |
36 |
1 |
11 |
27 |
52.94% |
| |
Carter Rode |
20 |
76 |
60 |
284 |
3.737 |
9 |
.118 |
13 |
.171 |
0 |
0 |
33 |
10 |
12 |
38 |
50.00% |
| |
Jake Bevere |
20 |
60 |
44 |
256 |
4.267 |
9 |
.150 |
16 |
.267 |
0 |
0 |
18 |
2 |
8 |
30 |
50.00% |
| |
Nathan Halasinski |
15 |
24 |
20 |
97 |
4.042 |
3 |
.125 |
7 |
.292 |
0 |
0 |
10 |
0 |
3 |
12 |
50.00% |
| |
Drew Layton |
19 |
49 |
42 |
159 |
3.245 |
2 |
.041 |
6 |
.122 |
0 |
0 |
20 |
4 |
16 |
24 |
48.98% |
| |
Grayson Beamer |
23 |
84 |
66 |
296 |
3.524 |
7 |
.083 |
13 |
.155 |
0 |
0 |
35 |
4 |
17 |
40 |
47.62% |
| |
Andrew Figler |
23 |
80 |
69 |
307 |
3.837 |
12 |
.150 |
15 |
.188 |
0 |
0 |
39 |
4 |
11 |
32 |
40.00% |
| |
Turnner Giles |
19 |
50 |
44 |
180 |
3.600 |
4 |
.080 |
5 |
.100 |
0 |
1 |
20 |
2 |
11 |
19 |
38.00% |
| |
Justin Blyer |
2 |
8 |
7 |
37 |
4.625 |
1 |
.125 |
3 |
.375 |
0 |
0 |
3 |
0 |
0 |
3 |
37.50% |
| |
Hunter Selander |
21 |
66 |
58 |
216 |
3.273 |
3 |
.045 |
6 |
.091 |
0 |
0 |
41 |
5 |
15 |
24 |
36.36% |
| |
Austin Pugh |
20 |
76 |
70 |
238 |
3.132 |
4 |
.053 |
7 |
.092 |
0 |
1 |
36 |
5 |
15 |
26 |
34.21% |
| |
Jackson Kandle |
1 |
3 |
3 |
11 |
3.667 |
0 |
.000 |
0 |
.000 |
0 |
0 |
1 |
1 |
1 |
1 |
33.33% |
| |
Christan Marcelli |
11 |
12 |
9 |
40 |
3.333 |
1 |
.083 |
2 |
.167 |
0 |
0 |
5 |
1 |
1 |
3 |
25.00% |
| |
Kyle Kerchner |
16 |
28 |
26 |
99 |
3.536 |
4 |
.143 |
3 |
.107 |
0 |
0 |
18 |
0 |
1 |
7 |
25.00% |
| 23 |
756 |
627 |
2746 |
3.632 |
76 |
.101 |
124 |
.164 |
1 |
4 |
144 |
51 |
144 |
341 |
45.11% |
Louisville Leopards 2017 Freshman Baseball Pitching Statistics
Standard
| |
Austin Pugh |
1.0 |
1 |
0 |
0 |
0 |
0 |
0 |
0 |
.000 |
0 |
0 |
0 |
1 |
0 |
0 |
.000 |
1.000 |
| |
Justin Blyer |
4.1 |
1 |
0 |
1 |
0 |
0 |
0 |
0 |
.000 |
0 |
0 |
0 |
1 |
4 |
0 |
.000 |
.231 |
| |
Kyle Kerchner |
0.0 |
1 |
0 |
0 |
0 |
0 |
0 |
0 |
.000 |
0 |
0 |
0 |
0 |
0 |
0 |
.000 |
.000 |
| |
Nathan Halasinski |
0.0 |
2 |
0 |
0 |
0 |
0 |
0 |
0 |
.000 |
0 |
0 |
0 |
0 |
0 |
0 |
.000 |
.000 |
| |
Josh Nolte |
4.2 |
1 |
0 |
0 |
0 |
0 |
0 |
0 |
.000 |
5 |
1 |
1 |
1 |
5 |
0 |
1.500 |
1.286 |
| |
Carter Rode |
29.0 |
8 |
8 |
4 |
0 |
0 |
0 |
0 |
.000 |
24 |
12 |
10 |
17 |
37 |
2 |
2.414 |
1.414 |
| |
Turnner Giles |
16.0 |
7 |
2 |
0 |
0 |
0 |
0 |
0 |
.000 |
13 |
10 |
6 |
9 |
16 |
5 |
2.625 |
1.375 |
| |
Jake Bevere |
23.0 |
9 |
4 |
0 |
0 |
0 |
0 |
0 |
.000 |
22 |
17 |
9 |
12 |
12 |
3 |
2.739 |
1.478 |
| |
Logan Vanicek |
20.1 |
7 |
0 |
0 |
0 |
0 |
0 |
0 |
.000 |
22 |
18 |
9 |
10 |
17 |
3 |
3.098 |
1.574 |
| |
Christan Marcelli |
25.0 |
14 |
3 |
2 |
0 |
0 |
0 |
0 |
.000 |
24 |
27 |
15 |
23 |
13 |
5 |
4.200 |
1.880 |
| |
Hunter Selander |
21.0 |
6 |
5 |
2 |
0 |
0 |
0 |
0 |
.000 |
22 |
23 |
16 |
17 |
7 |
4 |
5.333 |
1.857 |
| |
Grayson Beamer |
4.1 |
4 |
1 |
0 |
0 |
0 |
0 |
0 |
.000 |
4 |
12 |
6 |
8 |
3 |
4 |
9.692 |
2.769 |
| 148.2 |
23 |
23 |
9 |
0 |
0 |
0 |
0 |
.000 |
136 |
120 |
71 |
99 |
114 |
26 |
3.343 |
1.581 |
Efficiency
| |
Hunter Selander |
21.0 |
110 |
364 |
193 |
171 |
17.333 |
3.309 |
61 |
.555 |
15 |
7 |
4 |
9 |
5.137 |
| |
Josh Nolte |
4.2 |
20 |
71 |
47 |
24 |
15.214 |
3.550 |
11 |
.550 |
4 |
2 |
0 |
1 |
1.445 |
| |
Logan Vanicek |
20.1 |
101 |
337 |
200 |
137 |
16.574 |
3.337 |
53 |
.525 |
9 |
5 |
2 |
5 |
3.086 |
| |
Jake Bevere |
23.0 |
111 |
391 |
241 |
150 |
17.000 |
3.523 |
56 |
.505 |
15 |
7 |
5 |
8 |
4.244 |
| |
Austin Pugh |
1.0 |
4 |
11 |
5 |
6 |
11.000 |
2.750 |
2 |
.500 |
0 |
0 |
0 |
1 |
5.860 |
| |
Turnner Giles |
16.0 |
76 |
258 |
149 |
109 |
16.125 |
3.395 |
35 |
.461 |
11 |
7 |
4 |
6 |
3.357 |
| |
Justin Blyer |
4.1 |
14 |
51 |
29 |
22 |
11.769 |
3.643 |
6 |
.429 |
4 |
4 |
3 |
3 |
1.811 |
| |
Christan Marcelli |
25.0 |
134 |
501 |
270 |
231 |
20.040 |
3.739 |
57 |
.425 |
17 |
9 |
4 |
10 |
5.051 |
| |
Carter Rode |
29.0 |
127 |
503 |
301 |
202 |
17.345 |
3.961 |
50 |
.394 |
18 |
13 |
8 |
10 |
2.174 |
| |
Grayson Beamer |
4.1 |
32 |
118 |
52 |
66 |
27.231 |
3.688 |
11 |
.344 |
2 |
1 |
1 |
0 |
9.064 |
| |
Kyle Kerchner |
0.0 |
0 |
0 |
0 |
0 |
.000 |
.000 |
0 |
.000 |
0 |
0 |
0 |
0 |
.000 |
| |
Nathan Halasinski |
0.0 |
0 |
0 |
0 |
0 |
.000 |
.000 |
0 |
.000 |
0 |
0 |
0 |
0 |
.000 |
| 148.2 |
729 |
2605 |
1487 |
1118 |
17.522 |
3.573 |
342 |
.469 |
95 |
55 |
31 |
53 |
3.841 |
Command
| |
Josh Nolte |
4.2 |
20 |
47 |
.662 |
15 |
.750 |
.733 |
.000 |
.267 |
.214 |
3 |
0 |
0 |
0 |
1 |
| |
Jake Bevere |
23.0 |
111 |
241 |
.616 |
58 |
.523 |
.707 |
.034 |
.224 |
.522 |
14 |
5 |
1 |
1 |
5 |
| |
Carter Rode |
29.0 |
127 |
301 |
.598 |
77 |
.606 |
.701 |
.065 |
.208 |
.586 |
16 |
4 |
3 |
1 |
1 |
| |
Logan Vanicek |
20.1 |
101 |
200 |
.593 |
57 |
.564 |
.667 |
.035 |
.263 |
.492 |
10 |
5 |
2 |
1 |
3 |
| |
Turnner Giles |
16.0 |
76 |
149 |
.578 |
44 |
.579 |
.636 |
.091 |
.250 |
.563 |
11 |
2 |
1 |
1 |
5 |
| |
Justin Blyer |
4.1 |
14 |
29 |
.569 |
7 |
.500 |
1.000 |
.000 |
.000 |
.231 |
3 |
0 |
0 |
0 |
0 |
| |
Christan Marcelli |
25.0 |
134 |
270 |
.539 |
58 |
.433 |
.724 |
.017 |
.241 |
.920 |
12 |
11 |
4 |
2 |
3 |
| |
Hunter Selander |
21.0 |
110 |
193 |
.530 |
52 |
.473 |
.692 |
.077 |
.192 |
.810 |
8 |
6 |
4 |
2 |
0 |
| |
Austin Pugh |
1.0 |
4 |
5 |
.455 |
3 |
.750 |
1.000 |
.000 |
.000 |
1.000 |
0 |
0 |
1 |
0 |
0 |
| |
Grayson Beamer |
4.1 |
32 |
52 |
.441 |
14 |
.438 |
.643 |
.214 |
.143 |
1.846 |
2 |
3 |
2 |
2 |
2 |
| |
Kyle Kerchner |
0.0 |
0 |
0 |
.000 |
0 |
.000 |
.000 |
.000 |
.000 |
.000 |
0 |
0 |
0 |
0 |
0 |
| |
Nathan Halasinski |
0.0 |
0 |
0 |
.000 |
0 |
.000 |
.000 |
.000 |
.000 |
.000 |
0 |
0 |
0 |
0 |
0 |
| 148.2 |
729 |
1487 |
.571 |
385 |
.528 |
.699 |
.055 |
.221 |
.666 |
79 |
36 |
18 |
10 |
20 |
Batter Results
| |
Austin Pugh |
1.0 |
4 |
3 |
11 |
0 |
.000 |
0 |
.000 |
.000 |
.000 |
1.000 |
.000 |
.667 |
.333 |
1 |
1 |
1.000 |
.000 |
0 |
| |
Justin Blyer |
4.1 |
14 |
13 |
51 |
8 |
.157 |
4 |
6.462 |
.286 |
4.000 |
1.000 |
.000 |
.778 |
.222 |
7 |
2 |
3.500 |
.000 |
0 |
| |
Kyle Kerchner |
0.0 |
0 |
0 |
0 |
0 |
.000 |
0 |
.000 |
.000 |
.000 |
.000 |
.000 |
.000 |
.000 |
0 |
0 |
.000 |
.000 |
0 |
| |
Nathan Halasinski |
0.0 |
0 |
0 |
0 |
0 |
.000 |
0 |
.000 |
.000 |
.000 |
.000 |
.000 |
.000 |
.000 |
0 |
0 |
.000 |
.000 |
0 |
| |
Grayson Beamer |
4.1 |
32 |
20 |
118 |
8 |
.068 |
3 |
4.846 |
.094 |
.375 |
.882 |
.118 |
.706 |
.294 |
4 |
4 |
1.000 |
.200 |
0 |
| |
Turnner Giles |
16.0 |
76 |
62 |
258 |
38 |
.147 |
16 |
7.000 |
.211 |
1.778 |
.848 |
.152 |
.522 |
.478 |
12 |
13 |
.923 |
.210 |
0 |
| |
Carter Rode |
29.0 |
127 |
107 |
503 |
64 |
.127 |
37 |
8.931 |
.291 |
2.176 |
.775 |
.225 |
.565 |
.435 |
24 |
13 |
1.846 |
.224 |
0 |
| |
Christan Marcelli |
25.0 |
134 |
105 |
501 |
48 |
.096 |
13 |
3.640 |
.097 |
.565 |
.806 |
.194 |
.413 |
.587 |
21 |
33 |
.636 |
.229 |
0 |
| |
Jake Bevere |
23.0 |
111 |
94 |
391 |
38 |
.097 |
12 |
3.652 |
.108 |
1.000 |
.810 |
.190 |
.422 |
.578 |
22 |
27 |
.815 |
.234 |
1 |
| |
Hunter Selander |
21.0 |
110 |
87 |
364 |
21 |
.058 |
7 |
2.333 |
.064 |
.412 |
.805 |
.195 |
.494 |
.506 |
24 |
23 |
1.043 |
.253 |
0 |
| |
Logan Vanicek |
20.1 |
101 |
85 |
337 |
33 |
.098 |
17 |
5.852 |
.168 |
1.700 |
.775 |
.225 |
.429 |
.571 |
13 |
24 |
.542 |
.259 |
0 |
| |
Josh Nolte |
4.2 |
20 |
19 |
71 |
7 |
.099 |
5 |
7.500 |
.250 |
5.000 |
.857 |
.143 |
.286 |
.714 |
1 |
7 |
.143 |
.263 |
0 |
| 148.2 |
729 |
595 |
2605 |
265 |
.102 |
114 |
5.368 |
.156 |
1.152 |
.810 |
.190 |
.477 |
.523 |
129 |
147 |
.878 |
.229 |
1 |
Runs & Running Game
| |
Kyle Kerchner |
0.0 |
0 |
0 |
0 |
0 |
0 |
.000 |
| |
Nathan Halasinski |
0.0 |
0 |
0 |
0 |
0 |
0 |
.000 |
| |
Jake Bevere |
23.0 |
25 |
0 |
1 |
3 |
1 |
.750 |
| |
Turnner Giles |
16.0 |
17 |
0 |
0 |
3 |
1 |
.750 |
| |
Carter Rode |
29.0 |
28 |
0 |
0 |
13 |
4 |
.765 |
| |
Logan Vanicek |
20.1 |
26 |
1 |
1 |
13 |
2 |
.867 |
| |
Christan Marcelli |
25.0 |
26 |
0 |
0 |
17 |
1 |
.944 |
| |
Austin Pugh |
1.0 |
1 |
0 |
0 |
1 |
0 |
1.000 |
| |
Grayson Beamer |
4.1 |
5 |
0 |
0 |
2 |
0 |
1.000 |
| |
Hunter Selander |
21.0 |
20 |
0 |
0 |
14 |
0 |
1.000 |
| |
Josh Nolte |
4.2 |
7 |
0 |
0 |
1 |
0 |
1.000 |
| |
Justin Blyer |
4.1 |
2 |
0 |
0 |
2 |
0 |
1.000 |
| 148.2 |
157 |
1 |
2 |
69 |
9 |
.885 |
Louisville Leopards 2017 Freshman Baseball Fielding Statistics
Standard
| |
Drew Layton |
19 |
0 |
19 |
0 |
0 |
0 |
1.000 |
| |
Jackson Kandle |
7 |
0 |
7 |
0 |
0 |
0 |
1.000 |
| |
Josh Nolte |
6 |
0 |
6 |
0 |
0 |
0 |
1.000 |
| |
Justin Blyer |
6 |
0 |
6 |
0 |
1 |
0 |
1.000 |
| |
Hunter Selander |
100 |
6 |
89 |
5 |
0 |
0 |
.950 |
| |
Jake Bevere |
36 |
1 |
33 |
2 |
2 |
0 |
.944 |
| |
Logan Vanicek |
34 |
4 |
28 |
2 |
5 |
0 |
.941 |
| |
Andrew Figler |
46 |
1 |
42 |
3 |
1 |
0 |
.935 |
| |
Carter Rode |
62 |
5 |
51 |
6 |
2 |
0 |
.903 |
| |
Jonah Harsh |
38 |
1 |
33 |
4 |
1 |
0 |
.895 |
| |
Christan Marcelli |
8 |
1 |
6 |
1 |
0 |
0 |
.875 |
| |
Austin Pugh |
76 |
7 |
58 |
11 |
5 |
0 |
.855 |
| |
Nathan Halasinski |
6 |
0 |
5 |
1 |
0 |
0 |
.833 |
| |
Grayson Beamer |
58 |
7 |
35 |
16 |
2 |
0 |
.724 |
| |
Turnner Giles |
32 |
1 |
22 |
9 |
1 |
0 |
.719 |
| |
Kyle Kerchner |
7 |
0 |
5 |
2 |
0 |
0 |
.714 |
| 541 |
34 |
445 |
62 |
18 |
0 |
.885 |
Catching
| |
Carter Rode |
63.0 |
12 |
27 |
27-32 |
5 |
.156 |
0 |
0 |
| |
Hunter Selander |
66.2 |
16 |
31 |
31-35 |
4 |
.114 |
0 |
0 |
| |
Christan Marcelli |
3.0 |
0 |
2 |
2-2 |
0 |
.000 |
0 |
0 |
| |
Drew Layton |
9.0 |
1 |
8 |
8-8 |
0 |
.000 |
0 |
0 |
| |
Jackson Kandle |
7.0 |
0 |
1 |
1-1 |
0 |
.000 |
0 |
0 |
| |
Nathan Halasinski |
0.0 |
0 |
0 |
0-0 |
0 |
.000 |
0 |
0 |
| 148.2 |
29 |
69 |
69-78 |
9 |
.115 |
0 |
0 |